The full version of this regression analysis is available for download here
Introduction
The World Happiness Report, published by the United Nation’s Sustainable Development Solutions Network, is an annual survey whose findings reflect the state of happiness of people, split by country, throughout the world. Happiness is rated on a 0-10 scale in which countries can be evaluated and compared to one another. These ratings are created by considering the economic, social, health, and democratic factors within a country and normalizing, typically into a percentage of population or, sometimes, a more subjective 0-1 rating. While this happiness score found by the United Nations to quantify well-being is obviously strongly correlated to the independent variables they used to quantify it, only the final happiness scores were used in the dataset for this project. The primary goal of this analysis is to determine if there is any kind of relationship between a country’s happiness index with other specific key factors chosen, and if this relationship can allow for future prediction of a country’s happiness level.
Quantitative Predictors
Quantitative values include ‘GDP’, ‘Life Expectancy”, ‘Births per 1000’, ‘Infant Mortality per 1000’, ‘Urban Percentage’, ‘Female Workforce Percent’, and ‘Inequality gini’. GDP is the gross domestic product per capita. Life expectancy is the average healthy expected life span of a person from the country in years. Births per 1000 is the birthrate of the country per 1000 people, while infant mortality per 1000 is the death rate of children under the age of one per 1000 births. Urban percentage is the percent of the country’s population that lives within an urbanized area and female workplace percent is the percentage of the workforce in a country that is female. Finally, inequality gini displays the wealth distribution of a country, where 0 equates to perfect equality and 1 would represent a vast disproportion where the overwhelming majority of wealth is in the hands of a select few.
Qualitative Predictors
Variables ‘democracy’ and ‘LGBT freedom’ represent the two qualitative fields in the project. Democracy is split categorically into varying levels of democratic freedom of a country. Levels in this field, in descending order of freedom, are: full, flawed, hybrid, and authoritarian. LGBT freedom represents the amount of laws passed in a country which protect the civil rights of lesbian, gay, bisexual, and transgender people. The levels for this variable are: high, some, and low. These levels were primarily determined based on marriage, adoption, military service, anti-discrimination, and gender identity laws a country has passed.
EDA
Visually exploring the data can provide several insights into how to proceed with regression analysis for this particular dataset. Below is a subset of the data- the top five ‘happiest’ countries- to give an idea of what the sample looks like. Scandinavia dominates.
Country GPD Happiness score Life Expectancy Births per 1000 Infant Mortality per 1000 Urban Percent Female Workforce Percent Democracy Score LGBT freedom Inequality Gini Denmark 51989.293 7.526 80.548 10.1 2.9 87.676 47.687 full high 29.1 Switzerland 80945.079 7.508 82.848 10.2 3.4 73.912 46.151 full some 31.6 Iceland 50173.339 7.500 82.060 13.4 1.6 94.137 47.627 full high 26.9 Norway 74400.369 7.498 81.751 11.5 2 80.473 47.110 full high 25.9 Finland 42311.036 7.413 81.129 10.5 1.9 84.221 47.740 full high 27.1
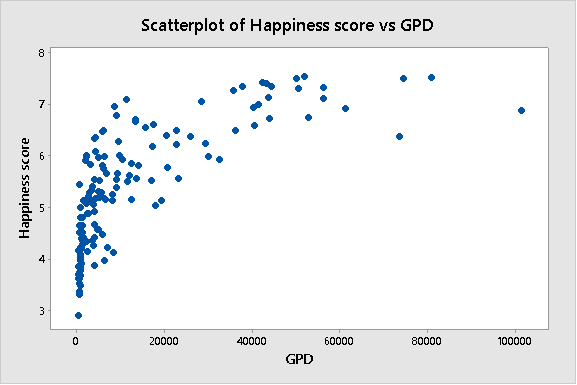
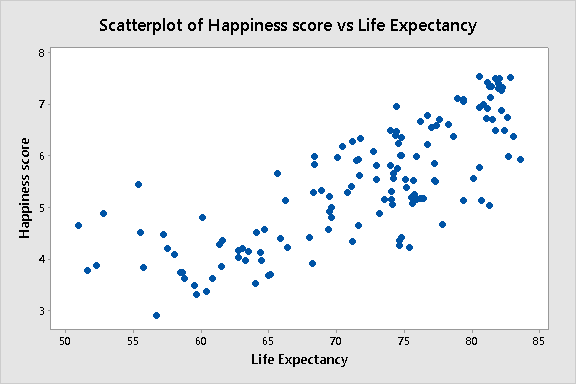
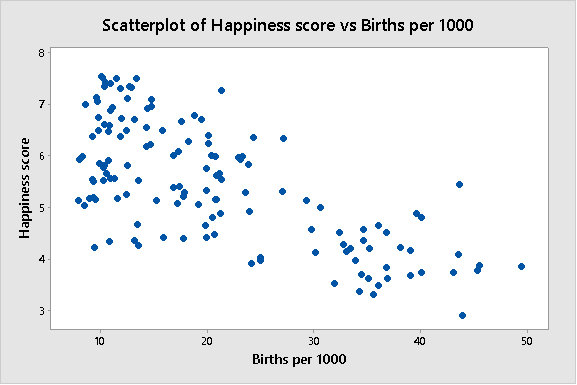
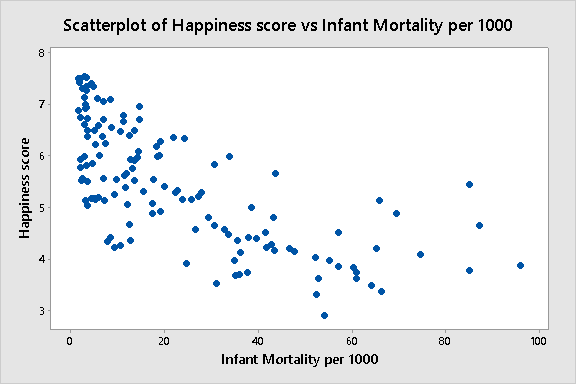
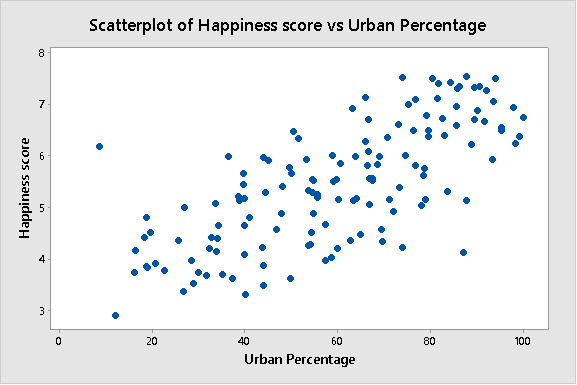
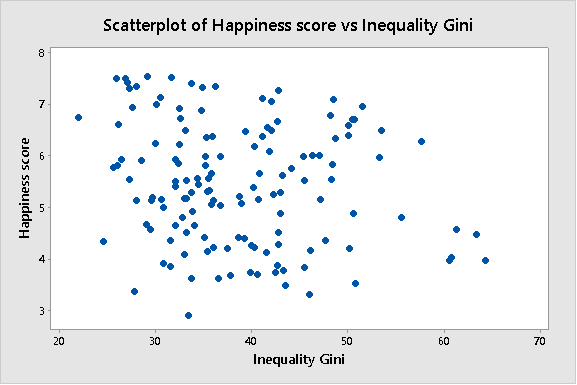
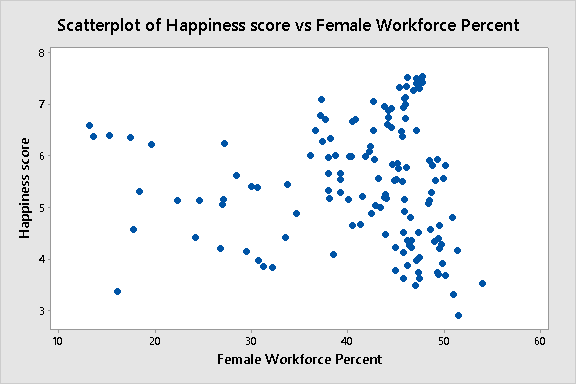
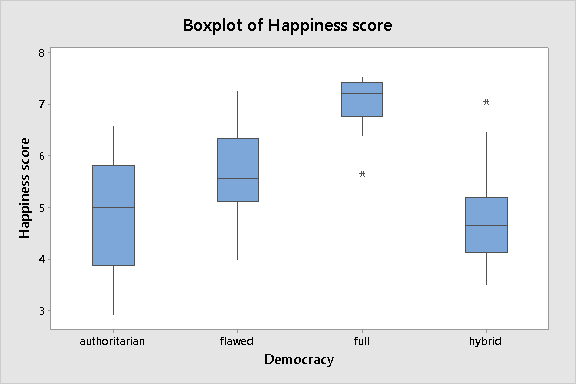
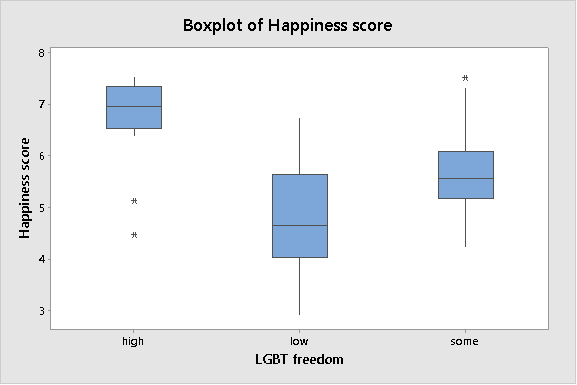
Visually inspecting these plots shows that most of the single-order variables have at least some level of effect on happiness of a country. Inequality gini and female workforce percentage appear to have little to no correlation, while the other six quantitative predictors depict a strong relationship, be it linear or curvilinear. The qualitative variable boxplots also seem to display an expected, significant relationship amongst each fields respective categories.
Least-Squares Regression
HAPPINESS SCORE = 0.27 + 0.000011 GDP + 0.0605 LIFE EXPECTANCY - 0.0080 BIRTHS PER 1000 + 0.00418 INFANT MORTALITY PER 1000 + 0.00839 URBAN PERCENTAGE - 0.00979 FEMALE WORKPLACE PERCENT + 0.01202 INEQUALITY GINI + 0.065 DEMOCRACY (FLAWED) + 0.438 DEMOCRACY (FULL)- 0.100 DEMOCRACY (HYBRID) + 0.406 LGBT FREEDOM (HIGH) + 0.142 LGBT FREEDOM (LOW)
Looking deeper into the variables, T-tests provide methods of determining the direct significance of each independent variable to the dependent. GDP, LIFE EXPECTANCY, and URBAN PERCENT are by far the strongest predictors of happiness in this model. The weakest appearing to be BIRTHS PER 1000 and INFANT MORTALITY PER 1000. The qualitative predictors encompassing the democracy type also have high p-values, yet should not necessarily be thrown out as they could provide added strength to the model, particularly when introducing interaction terms.
Interaction EDA
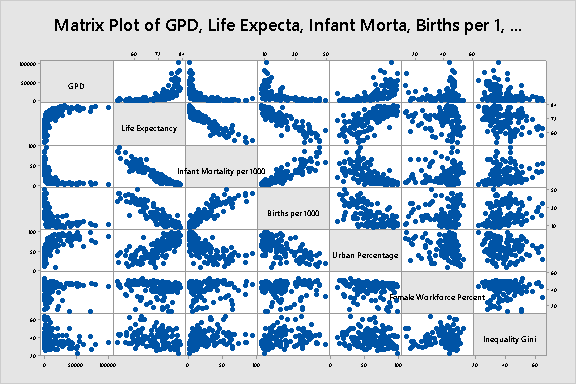
The matrix plot above gives a quick view of which predictors may have an effect on each other, (not necessarily in regards to happiness though). It is important to keep in mind that, while these scatterplots give an idea of relationships between independent variables, they may in fact be additive and not necessarily interactive. Female workforce percent and inequality gini both appear to have very little connection with other variables. The remaining five look to each have some type of linear or curvilinear relationship with other independent variables. While this implies some form of covariance, care must be taken watch for multicollinearity.
Stepwise Regression takes place here..
I opted to exclude this from the final write up for the site. A full version is available for download here
Final Model
Analysis of Variance
Source DF Adj SS Adj MS F-Value P-Value Regression 8 143.374 17.9217 55.07 0.000 GPD 1 17.388 17.3877 53.43 0.000 Births per 1000 1 2.172 2.1720 6.67 0.011 Female Workforce Percent 1 4.057 4.0574 12.47 0.001 GDP^2 1 7.704 7.7038 23.67 0.000 births^2 1 4.244 4.2440 13.04 0.000 female^2 1 5.076 5.0756 15.60 0.000 LGBT freedom 2 2.576 1.2880 3.96 0.021 Error 129 41.980 0.3254 Total 137 185.353
Model Summary
S R-sq R-sq(adj) R-sq(pred) 0.570459 77.35% 75.95% 74.26%
Coefficients
Term Coef SE Coef T-Value P-Value
Constant 2.197 0.802 2.74 0.007
GPD 0.000072 0.000010 7.31 0.000
Births per 1000 0.0750 0.0290 2.58 0.011
Female Workforce Percent 0.1365 0.0386 3.53 0.001
GDP^2 -0.000000 0.000000 -4.87 0.000
births^2 -0.001861 0.000515 -3.61 0.000
female^2 -0.002146 0.000543 -3.95 0.000
LGBT freedom
high 0.540 0.197 2.74 0.007
some 0.296 0.153 1.93 0.056
Regression Equation
Happiness score = 2.197 + 0.000072 GPD + 0.0750 Births per 1000 + 0.1365 Female Workforce Percent - 0.000000 GDP^2 - 0.001861 births^2 - 0.002146 female^2 + 0.540 LGBT freedom_high + 0.296 LGBT freedom_some
Conclusion
In this model, the significant indicators of a country’s happiness score are based on three quantitative predictors, GDP per capita, births per 1000, and female workplace percentage, and one qualitative terms, LGBT freedoms- which is split into three categories (low, some, high). It also takes all three of the quantitative predictors second-order terms into account when determining a final happiness score. With a model F-score of 55.07, P-value of < 0.000, and R2(adj) of 75.95, we can, with 99% confidence, explain around 76% the variance of the happiness score of a country based solely on these input. Furthermore, we can predict the future results of happiness of a country based on these same variables with an accuracy of around 74%, based on our final r-sq(pred) score. Finally, a standard error of .57 indicates that 95% of the actual results will fall within 1.14 points of the model’s predicted score. In regards to this regression, GDP and LGTB freedom are both strong, positive indicators of the happiness of a country, while births and female workplace tend to a slight, negative correlation with the final score once reaching their specific, curvilinear maxes. Although the female workplace^2’s coefficient may bring the validity of full civil liberties into question, this regression does appear to imply that the stronger the economy and more robust the civil liberties of a country, the happier it’s population.... as long as there are not too many babies being born.
References
The Economist Intelligence Unit. (2015). Democracy Index 2015. Retrieved from http://www.yabiladi.com/img/content/EIU-Democracy-Index-2015.pdf.
The World Bank. (2016). World Bank Open Data. Retrieved from http://data.worldbank.org/.
United Nations. (2016). Edited by John Helliwelll, Richard Layard, and Jeffrey Sachs. World Happiness Report 2016. Retrieved from http://worldhappiness.report/ed/2016/.
Zhong, Raymond. (2015). ‘In Bhutan, Gross National Happiness Trumps Gross National Product.’ The Wall Street Journal. Retrieved from http://www.wsj.com/articles/in-bhutan-gross-national-happiness-trumps-gross-national-product-1450318359